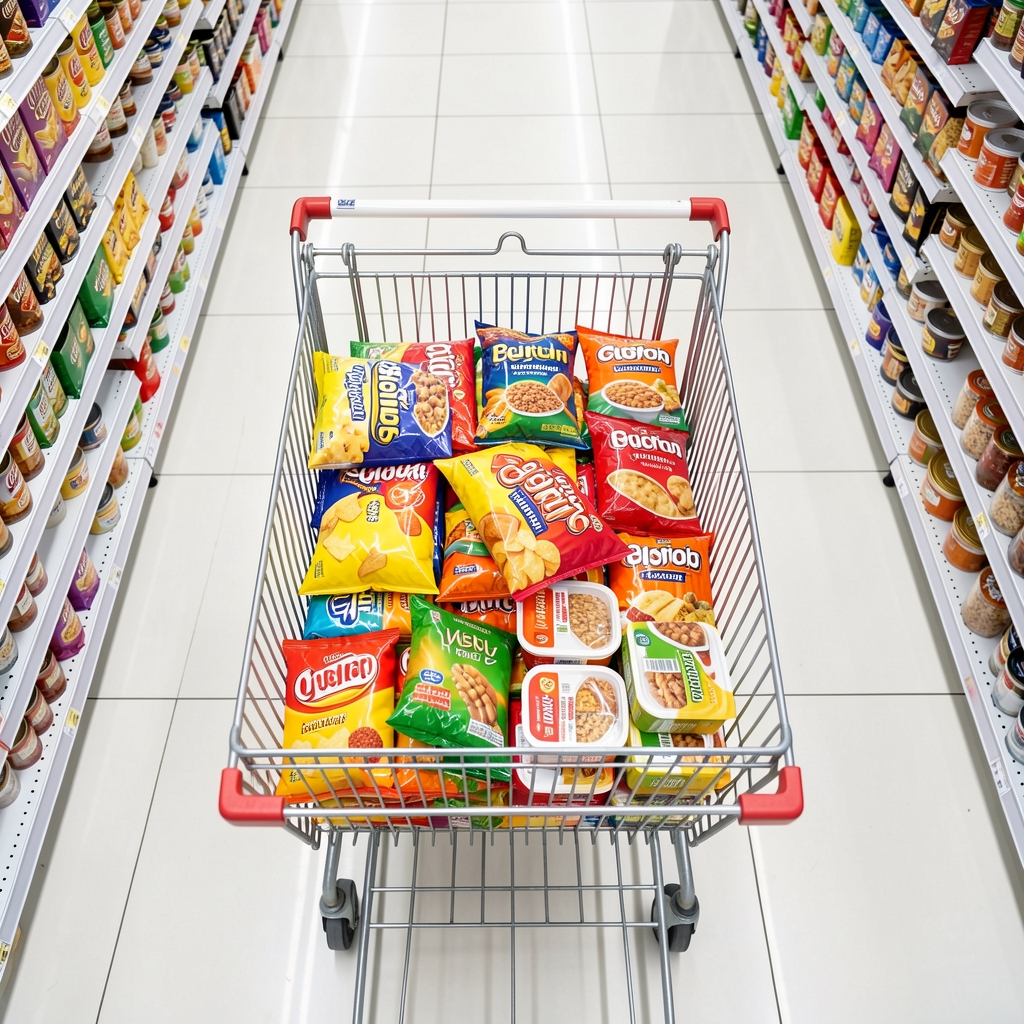
London, January 2026 — A four-week record of one household's purchasing pattern reveals something that aggregate data has long suggested: the weekly shop is not a neutral exercise in nutrition. It is a sequence of decisions shaped almost entirely by layout, pricing, and the number of minutes available on a Thursday evening.
The Architecture of the Trolley
When the observation period began on the second Saturday of January, the subject household — two adults, both working full-time — estimated that roughly a third of their weekly food spend went on what they called "proper cooking" ingredients. Vegetables, raw proteins, grains. The remainder, they acknowledged, was split between snacks, convenience ready meals, and what one of them described as "habit buys": the same brand of crisps, the same jar of pasta sauce, the same four-pack of flavoured yogurts that appeared in the trolley without conscious deliberation.
What the log revealed over four weeks was more specific than this self-assessment suggested. Of the 23 distinct product categories purchased across the period, 14 fell into classifications carrying either high-salt or high-refined-carbohydrate labelling under standard UK front-of-pack criteria. The household was not, by their own account, eating unhealthily. They were eating conveniently — and convenience, in the structure of a large UK supermarket, skews reliably toward processed food reliance.
This is not a personal failing. It is an environmental one. The placement of ambient-stable, shelf-ready products at eye level, the multi-buy promotions clustered around snack categories, the refrigerated ready-meal aisle positioned between the deli counter and the bakery — each of these is a documented feature of retail space design that influences purchasing outcomes independent of stated intentions.
What the Log Recorded: Week by Week
Week One proceeded without modification. The household shopped as normal. Total spend: £86. Products logged: 41 individual items. Of these, 27 carried some form of front-of-pack amber or red rating. Salt content was most consistently flagged — present at red-rated levels in 9 of the 41 items, including the pasta sauce, two varieties of ready soup, one brand of sliced bread, and three snack items.
Week Two introduced a single modification: the household was asked to review the salt content of their five most frequently purchased ambient products before shopping. They identified the bread and the pasta sauce as the highest-priority substitutions. Both were replaced with lower-salt alternatives available in the same supermarket, at comparable price points. The total red-rated salt items dropped from 9 to 6.
Week Three introduced a second modification: a list prepared in advance at home, cross-referenced against a simple nutritional summary of their most-purchased items. Shopping time increased by approximately twelve minutes. Red-rated items dropped to 4. The household noted, unprompted, that they had purchased two fewer ready meals than the prior week — not from a specific resolution, but because having a list made the default choice of ready meals feel less automatic.
Week Four returned to unmodified behaviour, to test whether the changes from weeks two and three persisted without active prompting. They did not, fully. Red-rated salt items returned to 7. The prepared-list practice was not repeated. The household estimated the shopping trip at approximately the same duration as week one. The log noted the reappearance of two snack products that had been absent in weeks two and three.
"The trolley doesn't lie. It records the gap between what we intend to eat and what the week actually allows."
Refined Carbohydrates and the Ready Meal Position
Across all four weeks, refined carbohydrate content — white flour products, products with added sugars exceeding 10g per 100g, heavily processed grain-based snacks — was the category least remarked upon by the household in self-reflection. Salt was visible to them as a concern. Sugar had some recognition. But the presence of white flour as the primary ingredient in eight regularly purchased products was noted with surprise only when pointed out during week three.
This is consistent with what nutritional awareness research documents about the perception hierarchy in everyday food evaluation. Consumers in UK studies consistently rank fat content as their primary concern, followed by calories, then sugar, then salt. Refined carbohydrate composition — the proportion of the product derived from white flour relative to wholegrain alternatives — rarely enters spontaneous evaluation. It is effectively invisible in the weekly shop, despite its consistent association with weight-related outcomes in longitudinal nutritional studies.
The ready meal question is more structural. Three ready meals were purchased in week one, two in week two, two in week three, and three in week four. These averaged 1.9g of salt per serving across the range purchased — a figure that approaches the recommended daily adult salt intake when combined with other meals containing salt. The household was aware that ready meals were high in salt in general terms. They were not aware of the specific figure, and found it notable when presented with it during the week three review.
The Role of Time Pressure
The factor most consistently cited by the household in post-shopping reflection was time. Not cost, not preference, not habit — time. The Thursday evening shop, conducted after work, produced consistently higher numbers of convenience and ready-meal purchases than the Saturday shop, conducted without a following schedule. This mirrors findings from several UK consumer behaviour studies documenting the relationship between shopping occasion timing and nutritional profile of purchases.
Time pressure does not operate through conscious trade-off reasoning. It does not produce the thought: "I am tired, therefore I will buy processed food." It operates through what researchers describe as decision fatigue and attentional narrowing: the shopper who arrives depleted defaults to familiar products, responds more readily to promotional placement, and spends less time reading labels. The result is a trolley assembled not by preference but by environmental affordance.
The gradual dietary improvement literature is consistent on one point about addressing this: the changes most likely to persist are those that reduce the decision load at the point of purchase, rather than attempting to increase willpower or nutritional knowledge. A list prepared at home, consulted in the shop, does more for purchase composition than a post-shop review of what was bought. The preparation work moves the decision outside the high-pressure context.
What a Month of Logging Reveals
Over the four-week period, the household's salt intake from purchased products — estimated from product labels — ranged from a low of approximately 6.2g per day in week three to a high of approximately 8.1g per day in week one and four. The recommended upper limit for UK adults is 6g per day. The household was not, by any ordinary measure, eating what they or others would describe as an extreme or unusual diet. They were eating normally. That normality, in the contemporary UK food environment, places daily salt intake consistently above recommended levels.
The observation period ended without prescriptive conclusion. The household received the log and the weekly summaries. They noted that seeing the figures had been "more useful than any general advice." The weekly shopping list practice was retained by one of the two household members in the weeks following the period. The other returned, by their own account, to previous patterns within ten days.
Gradual dietary improvement does not resolve in four weeks. What the four-week log does is document the specific points at which the processed food environment exerts its most consistent influence: Thursday evening, the ambient aisle, the multi-buy promotion, the unlabelled assumption about salt. Knowing where a pattern exerts itself is, at minimum, the foundation for deciding whether to address it.
- – 14 of 23 purchased product categories carried high-salt or high-refined-carbohydrate ratings across the four-week period.
- – A prepared shopping list — compiled at home before the shop — reduced red-rated items by more than any other single intervention tested.
- – Thursday evening shops produced consistently higher processed food purchase rates than weekend shops conducted without time pressure.
- – Refined carbohydrate content remained the least noticed category in self-evaluation, despite appearing in eight of the household's most regularly purchased products.
- – Estimated daily salt intake ranged from 6.2g to 8.1g across the four weeks, against a recommended upper limit of 6g for adults.